Improved Cross-Dataset Facial Expression Recognition by Handling Data Imbalance and Feature Confusion

Manogna Sreenivas1    Sawa Takamuku2    Soma Biswas1    Aditya Chepuri3    Balasubramanian Vengatesan3    Naotake Natori2

1Indian Institute of Science, Bengaluru, India    2Aisin Corporation, Tokyo, Japan    3Aisin Automotive Haryana Pvt Ltd., Bangalore, India
ECCVW, 2022

Abstract

Facial Expression Recognition (FER) models trained on one dataset (source) usually do not perform well on a different dataset (target) due to the implicit domain shift between different datasets. In addition, FER data is naturally highly imbalanced, with a majority of the samples belonging to few expressions like neutral, happy and relatively fewer samples coming from expressions like disgust, fear, etc., which makes the FER task even more challenging. This class imbalance of the source and target data (which may be different), along with other factors like similarity of few expressions, etc., can result in unsatisfactory target classification performance due to confusion between the different classes. In this work, we propose an integrated module, termed DIFC, which can not only handle the source Data Imbalance, but also the Feature Confusion of the target data for improved classification of the target expressions. We integrate this DIFC module with an existing Unsupervised Domain Adaptation (UDA) approach to handle the domain shift and show that the proposed simple yet effective module can result in significant performance improvement on four benchmark datasets for Cross-Dataset FER (CD-FER) task. We also show that the proposed module can be used with other UDA baselines to further boost their performance.

Problem Setting

The Cross-Dataset FER (CD-FER) task requires adapting a model trained on a labelled source FER dataset to correctly classify expressions on a different, unlabelled target dataset. Two complementary challenges make this difficult beyond standard domain shift:

  • Source Data Imbalance: FER datasets are naturally highly skewed. Expressions like happy and neutral dominate, while disgust, fear, and surprise have far fewer samples. The standard cross-entropy loss learns poor decision boundaries for minority classes, and this imbalance ratio varies substantially across datasets (Fig. 1).
  • Target Feature Confusion: The target dataset may have a different imbalance profile from the source. Additionally, inherent perceptual similarity between certain expressions causes the model to confuse nearby classes in feature space, an effect that source-supervised training alone cannot resolve.

Given a labelled source dataset \( \mathcal{D}_s = \{(x^i_s, y^i_s)\}_{i=1}^{n_s} \) with \( y^i_s \in \{1, \ldots, K\} \) and an unlabelled target dataset \( \mathcal{D}_t = \{x^i_t\}_{i=1}^{n_t} \) sharing the same label space, the goal is to correctly classify the target samples. For class \( k \) with \( N_k \) training samples, the imbalance ratio is:

\[ \text{Imbalance ratio}_k = \frac{N_k}{\min_j(N_j)}, \quad j,k \in \{1, \ldots, K\} \tag{1} \]
Imbalance ratio for different FER classes across datasets
Fig. 1: Imbalance ratio for different classes varies across FER datasets. Majority and minority classes differ by dataset, motivating class-dependent margins.

Proposed Method: DIFC

We propose the DIFC (Data Imbalance and Feature Confusion) module, which addresses both challenges in an integrated manner. DIFC replaces the standard cross-entropy classification loss in a UDA framework with a two-phase loss that first handles source imbalance and then adapts to target confusion.

Handling Data Imbalance (DI Loss)

Standard cross-entropy training on imbalanced data leads to poor margins for minority classes. We adopt Label Distribution Aware Margin (LDAM) loss, which enforces class-dependent margins: larger margins for minority classes relative to majority classes. Given source logits \( z_s = [z_1, \ldots, z_K]^\top \), the standard CE loss is:

\[ \mathcal{L}_\text{CE}(z_s, y_s) = -\log \frac{\exp(z_{y_s})}{\sum_{k=1}^{K} \exp(z_k)} \tag{2} \]

The DI loss modifies CE with class-dependent margins \( \Delta \in \mathbb{R}^K \):

\[ \mathcal{L}_\text{DI}(z_s, y_s; \Delta) = -\log \frac{e^{z_{y_s} - \Delta_{y_s}}}{e^{z_{y_s} - \Delta_{y_s}} + \sum_{k \neq y_s} e^{z_k}}, \quad \text{where } \Delta_k = \frac{\gamma}{N_k^{1/4}} \tag{3} \]

Here \( \gamma \) is a hyperparameter normalizing the margins. Following LDAM, we apply a deferred re-weighting scheme after a few initial epochs. Although effective for supervised imbalance, Eq. (3) uses source label distribution to compute margins, which may not match target data.

Handling Feature Confusion (FC)

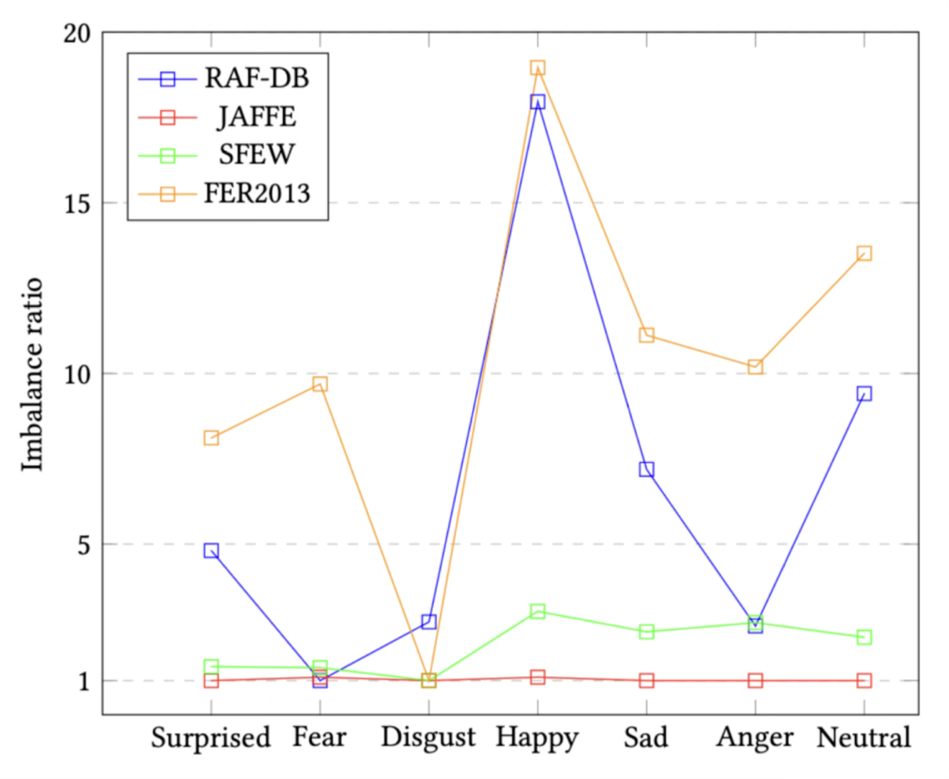
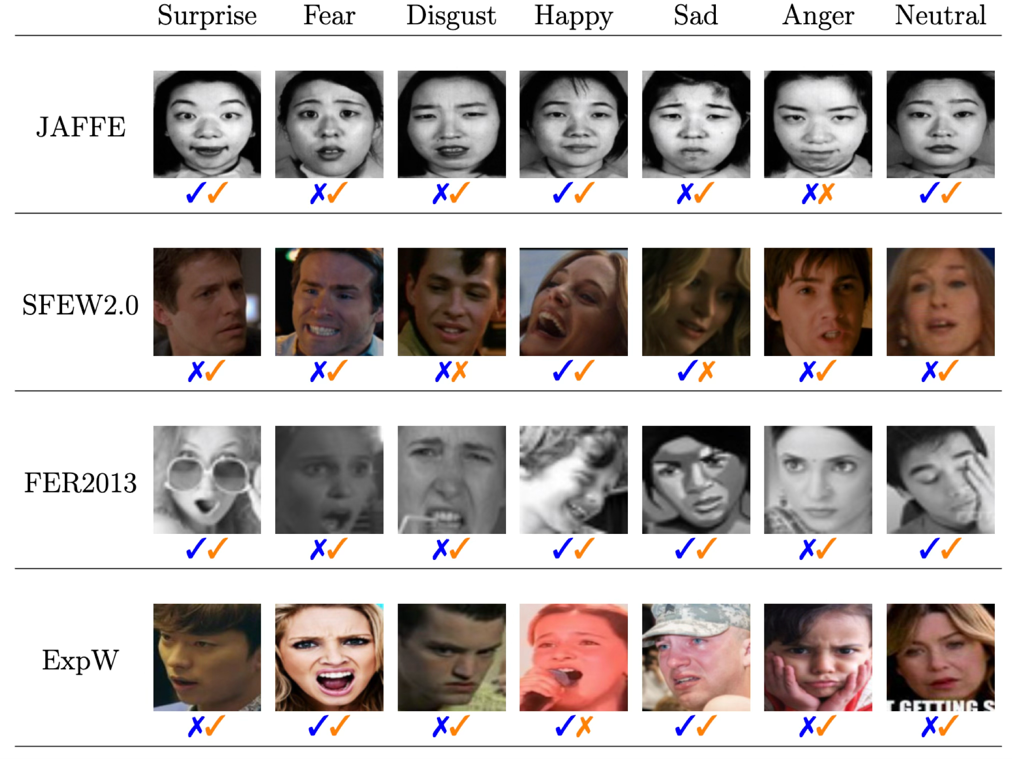
The final goal is to correctly classify the target features. Minority classes in the target may differ from those in the source, and inherent perceptual similarity between certain expressions causes additional confusion. We quantify this using a class confusion score estimated from model predictions on unlabelled target data.

Target samples are grouped into pseudo-class sets \( S_k \) based on current model predictions:

\[ S_k = \{x_t \mid \hat{y}_t = k\}, \quad \text{where} \quad \hat{y}_t = \arg\max(p_t) \tag{4} \]

For each class \( k \), the confusion score is the inverse of the average margin between the top-2 softmax scores across all samples predicted as class \( k \):

\[ \text{conf}_k = \frac{1}{\mathbb{E}_{x_t \in S_k} |p^1_t - p^2_t|} \tag{5} \]

A large average gap means the model is confident about class \( k \) (low confusion); a small gap means class \( k \) is frequently confused with another class (high confusion). Classes are sorted in decreasing order of confusion to obtain ordered indices \( C \). The DI margins are then updated with exponentially decaying increments to emphasize the most confusing classes:

\[ \Delta'_{C[j]} = \Delta_{C[j]} + \frac{\epsilon}{2^{j-1}}, \qquad \mathcal{L}_\text{DIFC} = \mathcal{L}_\text{DI}(x_t, y_t; \Delta') \tag{6} \]

Here \( \epsilon \) controls the margin increase for the most confusing class \( C[1] \). This formulation learns class boundaries that account for source imbalance while simultaneously reducing target confusion.

Integration with MCD Baseline

We integrate DIFC with Maximum Classifier Discrepancy (MCD), which uses a feature extractor \( F \) and two classifiers \( C_1, C_2 \). MCD optimizes three objectives:

\[ \min_{F,C_1,C_2} \; \mathcal{L}_\text{cls}(C_1(F(x_s)), y_s) + \mathcal{L}_\text{cls}(C_2(F(x_s)), y_s) \] \[ \max_{C_1,C_2} \; \|C_1(F(x_t)) - C_2(F(x_t))\|_1 \] \[ \min_{F} \; \|C_1(F(x_t)) - C_2(F(x_t))\|_1 \tag{7} \]

DIFC replaces the classification loss \( \mathcal{L}_\text{cls} \): DI loss is used for the initial \( T_1 \) epochs to stabilize source discrimination, then the full DIFC loss is used for epochs \( T_1+1 \) to \( T_2 \). Confusion scores are computed using the ensemble prediction:

\[ p_{t,i} = \text{softmax}(C_i(F(x_t))), \quad p_t = \tfrac{1}{2}(p_{t,1} + p_{t,2}), \quad \hat{y}_t = \arg\max_k(p_t) \tag{8} \]
Example facial expression predictions from DI and DIFC models
Fig. 2: Example model predictions comparing DI loss and DIFC loss on target dataset samples. DIFC corrects several samples misclassified under DI loss.

Results

Comparison with State-of-the-Art

Method JAFFE SFEW2.0 FER2013 ExpW Avg
CADA 52.11 53.44 57.61 63.15 56.58
SAFN 61.03 52.98 55.64 64.91 58.64
SWD 54.93 52.06 55.84 68.35 57.79
LPL 53.05 48.85 55.89 66.90 56.17
DETN 55.89 49.40 52.29 47.58 51.29
ECAN 57.28 52.29 56.46 47.37 53.35
JUMBOT 54.13 51.97 53.56 63.69 55.84
ETD 51.19 52.77 50.41 67.82 55.55
AGRA 61.50 56.43 58.95 68.50 61.34
Proposed DIFC 68.54 56.87 58.06 71.20 63.67

Table 1: Target classification accuracy (%). Source: RAF-DB. Backbone: ResNet-50. Results of baselines taken from AGRA. DIFC outperforms all methods on average and on JAFFE and ExpW.

Ablation Study

Loss JAFFE SFEW2.0 FER2013 ExpW Avg
CE 64.79 53.73 55.80 69.10 60.85
DI (LDAM) 67.14 55.90 57.30 70.70 62.76
DIFC 68.54 56.87 58.06 71.20 63.67

Table 2: Effect of each loss component with MCD as the base UDA method. DI loss adds ~2% over CE; DIFC further improves by adapting margins to target confusion.

Confusion Order Across Datasets

Dataset Surprise Fear Disgust Happy Sad Anger Neutral
JAFFE 5 1 2 7 3 6 4
SFEW2.0 4 2 5 7 3 6 1
FER2013 6 2 1 4 3 7 5
ExpW 3 1 2 7 4 5 6

Table 3: Order of confusion for each expression class per target dataset (1 = most confusing, 7 = least confusing), computed using Eq. (5) after the DI phase. Confusing classes vary by dataset and do not directly correspond to minority classes in Fig. 1.

Confusing vs. Non-Confusing Class Accuracy

Dataset Confusing Classes Non-Confusing Classes
DI DIFC DI DIFC
JAFFE 48.01 51.22 80.88 80.88
SFEW2.0 50.70 51.89 46.88 48.02
FER2013 34.57 38.09 67.58 67.41
ExpW 30.78 31.20 66.25 66.75

Table 4: Average per-class accuracy for the top-3 confusing classes vs. the remaining 4 classes, after DI and DIFC training. DIFC improves confusing-class accuracy without degrading non-confusing ones.

Plug-and-Play with Other UDA Methods

Loss DANN SAFN MCD Avg
CE 48.67 50.46 52.75 50.63
DI 50.12 51.81 53.25 51.73
DIFC 51.33 53.01 55.66 53.33

Table 5: DIFC as a plug-in replacement for CE loss across UDA methods. Target: SFEW2.0, source: RAF-DB, backbone: ResNet-18. DIFC consistently improves over CE across adversarial (DANN), non-adversarial (SAFN), and multi-classifier (MCD) baselines.

BibTeX

@InProceedings{sreenivas2022difc,
  author    = {Sreenivas, Manogna and Takamuku, Sawa and Biswas, Soma
               and Chepuri, Aditya and Vengatesan, Balasubramanian and Natori, Naotake},
  title     = {Improved Cross-Dataset Facial Expression Recognition by Handling
               Data Imbalance and Feature Confusion},
  booktitle = {ECCV Workshops},
  year      = {2022}
}